


Most tour operators set next year’s marketing budget the same way: last year’s number, plus a little, minus whatever felt wasted. The problem is that few of them can say what a booking actually cost them in 2026, especially once OTA commission is counted. October, with the season’s numbers still fresh, is the best time to replace that guesswork with a plan built on real data.
TL;DR
- Start with your 2026 bookings and revenue by channel: direct website, OTA, and phone or walk-up.
- Count OTA commission as a marketing cost. It is the price of acquiring those customers, even though it rarely appears in the marketing line.
- Use percent of revenue as a sanity check. Commonly cited U.S. Small Business Administration guidance puts marketing at 7% to 8% of gross revenue for businesses under $5 million in sales.
- Split the 2027 budget into three buckets: always-on (about 60%), seasonal push (about 30%), and test (about 10%).
- Pace spending to your booking window, not to the calendar, so money is in market when travelers are actually planning.
Why Most Tour Operator Budgets Miss the Real Cost of a Booking
Arival’s Global Operator Landscape (4th Edition, April 2026), a survey of 5,664 operators, found that direct bookings fell from 29% of total sales in 2024 to 25% in 2025, while 37% of bookings now come through OTAs. For many operators, the largest customer acquisition cost in the business is the commission paid to Viator, GetYourGuide, and similar platforms, which is why it pays to decide whether and how to use OTAs on purpose.
That commission usually sits in cost of sales or gets netted out of payouts, so it never shows up next to the Google Ads bill. The result is a budget that looks lean on paper while the business is actually spending heavily to acquire customers, just through someone else’s channel. A 2027 budget that ignores this will keep underfunding the channels the operator owns.
Step 1: Pull Your 2026 Numbers by Channel
Before setting a single 2027 figure, pull four numbers from the booking system for each channel:
- Number of bookings
- Gross revenue
- Average booking value
- Direct costs to acquire those bookings (ad spend, commission, agency or freelancer fees, tools)
Group channels into three or four lines at most: direct website, OTAs, phone and walk-up, and resellers or partners if they are significant. More detail than that rarely changes the decision.
Step 2: Calculate the True Cost per Booking
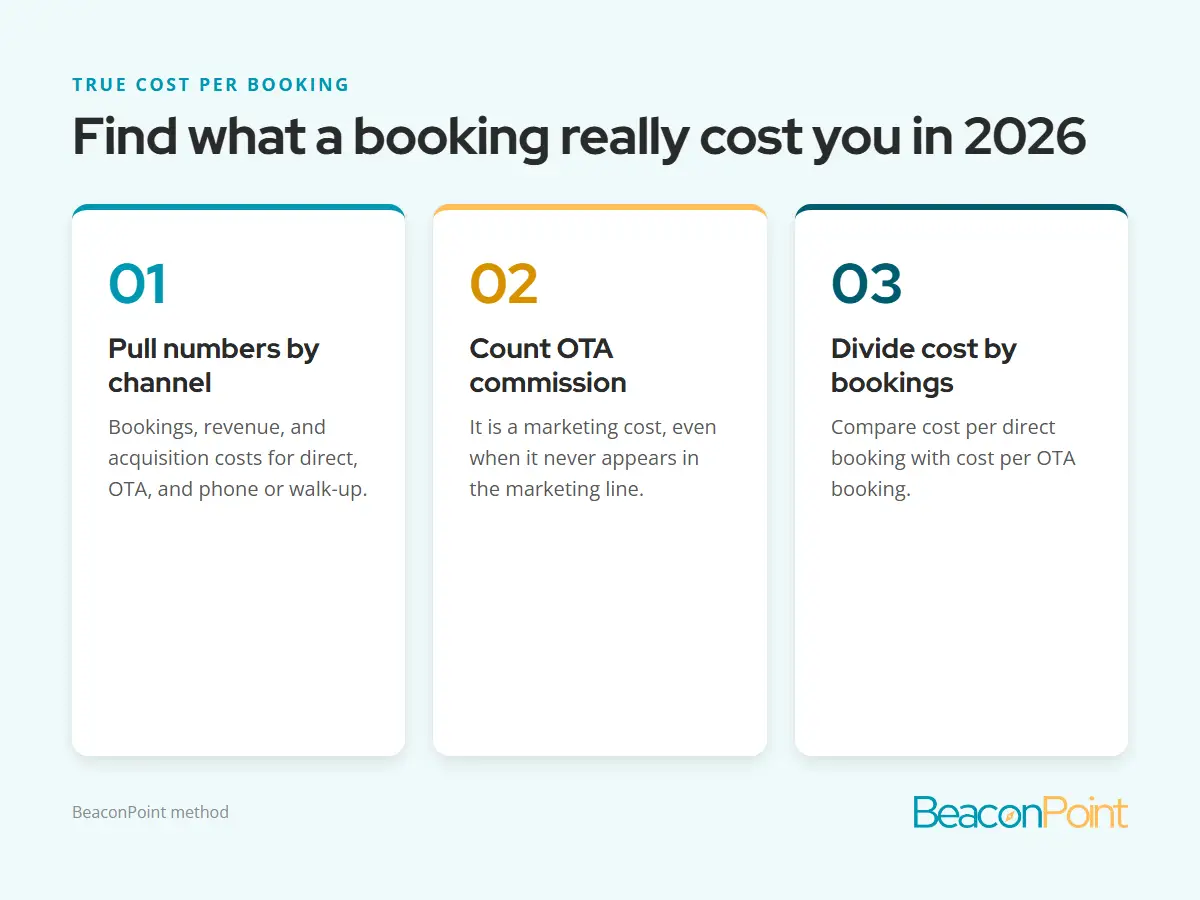
The true cost per booking is the total cost of acquiring bookings in a channel divided by the number of bookings that channel produced. For direct bookings, include ad spend, booking and email tools used for marketing, and any agency or freelancer fees. For OTAs, the cost is the commission.
Here is a worked example for an illustrative operator with $600,000 in 2026 revenue and a $120 average booking value.
| Channel | Bookings | Revenue | Acquisition Cost | Cost per Booking |
|---|---|---|---|---|
| Direct website | 2,250 | $270,000 | $42,000 (ads, tools, agency) | $18.67 |
| OTA | 1,750 | $210,000 | $52,500 (25% commission) | $30.00 |
| Phone and walk-up | 1,000 | $120,000 | Included in direct costs | n/a |
| Total | 5,000 | $600,000 | $94,500 | $18.90 |
On paper, this operator’s marketing budget is $42,000, or 7% of revenue. Counting OTA commission, the business actually spent $94,500, or 15.75% of revenue, to acquire customers. Each OTA booking cost $30.00, compared with $18.67 for a direct booking. That gap is the strongest argument for investing in direct channels in 2027, starting with your website’s conversion rate.
Step 3: Set the 2027 Total
There are two common ways to set the total, and seasonal operators should use both.
| Method | How It Works | Best For | Watch Out For |
|---|---|---|---|
| Percent of revenue | Budget a fixed share of projected revenue, such as 7% to 8% | A quick, defensible starting number | It ties spending to last year, not to goals |
| Goal-based | Work backward from a target number of direct bookings and the cost per booking | Operators with a clear growth target | It needs reliable cost per booking data |
Start with percent of revenue as the baseline, then check it against the goal. In the example, if the operator projects $640,000 in 2027 revenue, 8% gives a budget of $51,200, not counting OTA commission. If the goal is 450 more direct bookings at about $18.67 each, that adds roughly $8,400 in spend, which fits within the $9,200 increase from $42,000 to $51,200.
Step 4: Split the Budget Into Three Buckets
The 3-bucket model keeps the budget simple enough to manage while protecting the spending that matters most.
| Bucket | Share | What It Funds | 2027 Example ($51,200) |
|---|---|---|---|
| Always-on | 60% | Branded search, website and booking tools, email platform, review generation, SEO | $30,720 |
| Seasonal push | 30% | Pre-season and peak campaigns, early-booking offers, holiday gift card promotion | $15,360 |
| Test | 10% | One or two new channels or tactics, such as a new ad platform or partner program | $5,120 |
The always-on bucket is the foundation, and it should not be switched off in slow months. Branded search in particular protects the operator’s own name from competitors and resellers who bid on it. The seasonal push bucket follows the booking window. The test bucket gives the operator a small, controlled way to try something new without risking the core budget, and the winners graduate into the other two buckets the following year.
Step 5: Pace Spending to the Booking Window
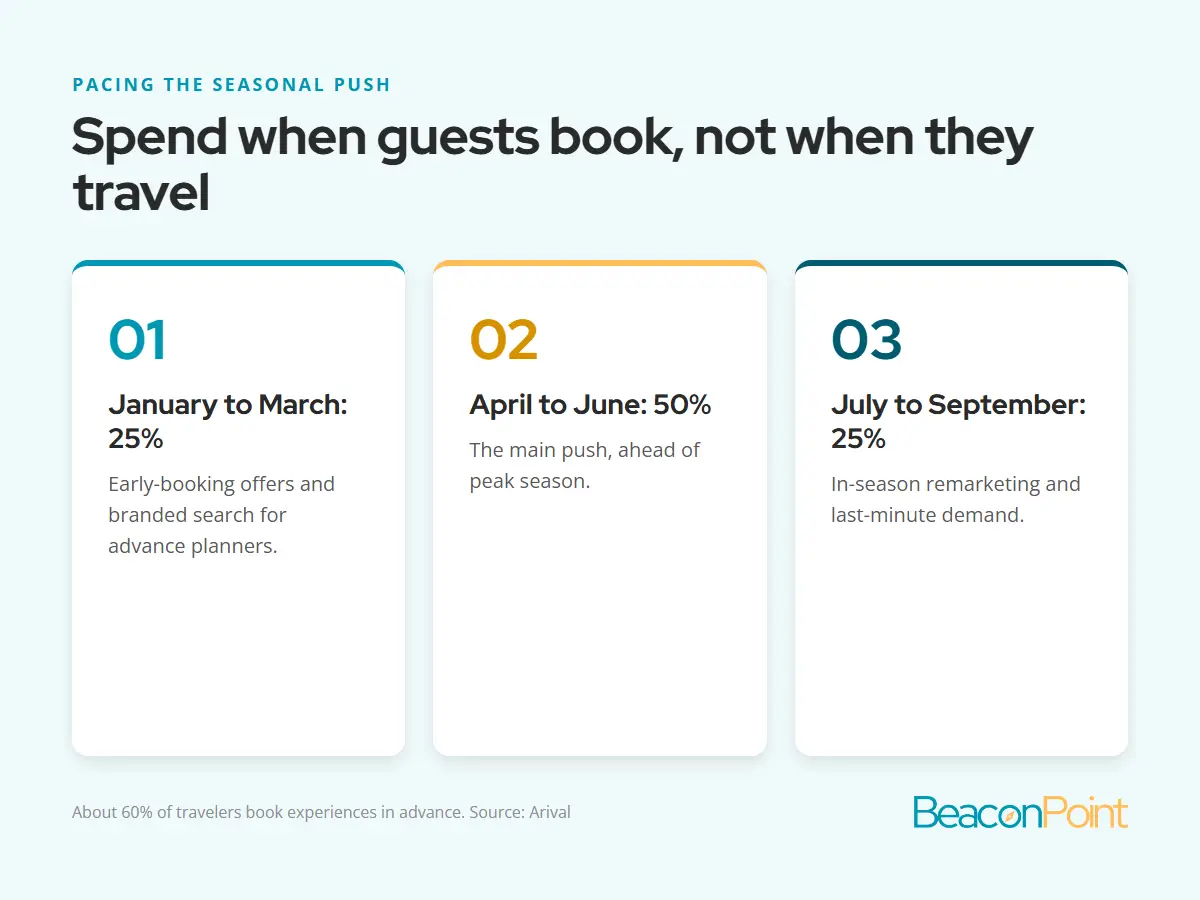
A budget only works if the money is in market when travelers are deciding. Arival research shows that roughly 60% of travelers book experiences in advance, so the seasonal push should start well before the first tour of the season.
A simple pacing rule for a spring through fall operator:
- January to March: early-booking campaigns and branded search, roughly a quarter of the seasonal push bucket.
- April to June: the main push, roughly half of the seasonal push bucket.
- July to September: in-season remarketing and last-minute demand, the remaining quarter.
- October to December: always-on only, plus a December gift card promotion.
Review actual results against this plan monthly. Moving money between months is normal. Moving money out of the always-on bucket should be rare.
Common Budgeting Mistakes to Avoid
- Leaving OTA commission out. It hides the real cost of customer acquisition and makes direct channels look expensive by comparison.
- Cutting brand search in the off-season. It is usually the cheapest traffic in the account and protects the operator’s name.
- Spending evenly across the year. Seasonal businesses need spending that follows demand, not the calendar.
- No test budget. Without one, the plan never improves and every new idea competes with proven spending.
Frequently Asked Questions
How much should a tour operator spend on marketing?
Commonly cited U.S. Small Business Administration guidance suggests 7% to 8% of gross revenue for businesses under $5 million in sales. Tour operators should treat that as a baseline for direct marketing spend and track OTA commission separately, because commission is also a customer acquisition cost.
Should OTA commission count as part of the marketing budget?
Yes, for planning purposes. Commission is what the operator pays to acquire OTA customers. Counting it shows the true cost per booking by channel and makes it clear whether shifting bookings to direct channels would save money.
What is the 3-bucket marketing budget model?
It splits the budget into always-on spending (about 60%) that runs all year, a seasonal push (about 30%) timed to the booking window, and a test bucket (about 10%) for trying new channels. The split keeps essential spending protected while leaving room to experiment.
When should a seasonal tour operator set next year’s budget?
October and November, while the season’s results are fresh and before early-booking campaigns need to launch in January.
What is a good cost per booking for a tour operator?
It depends on average booking value and margin. A useful test is to compare the cost per direct booking with the commission paid per OTA booking. If direct bookings cost less, every booking shifted from an OTA to the operator’s website improves profit.
Summary
A 2027 marketing budget built on real numbers takes an afternoon, and it changes how every dollar gets spent next season.
- Pull 2026 bookings, revenue, and acquisition costs by channel.
- Count OTA commission as a marketing cost to see the true cost per booking.
- Set the total with percent of revenue, then check it against a direct booking goal.
- Split it 60/30/10 across always-on, seasonal push, and test.
- Pace the seasonal push to the booking window.
BeaconPoint’s free 2027 Marketing Budget Planner for Tour Operators walks through each of these steps with fill-in worksheets. Operators who want help building the plan can talk to BeaconPoint.

Sources
- Arival, The Operator’s Marketing Playbook, The Global Operator Landscape (4th Ed.), April 2026: direct bookings fell from 29% of sales in 2024 to 25% in 2025; 37% of bookings go through OTAs; 5,664 operators surveyed.
- Arival, Why Travelers Book Experiences in Advance (or Not): about 60% of travelers book experiences in advance.
- U.S. Small Business Administration guidance, as commonly cited: 7% to 8% of gross revenue on marketing for businesses under $5 million in sales.